Highlight: The impact of Australia’s 2019-20 bushfires on tourism supply chains
Assessment of the globally unprecedented megafires using quantitative disaster analysis.
This research applied the popular disaster analysis technique, which is a sub-stream of input-output analysis (IO), to Australia’s catastrophic 2019-20 bushfires. It was the first study of the megafires to use IO analysis.
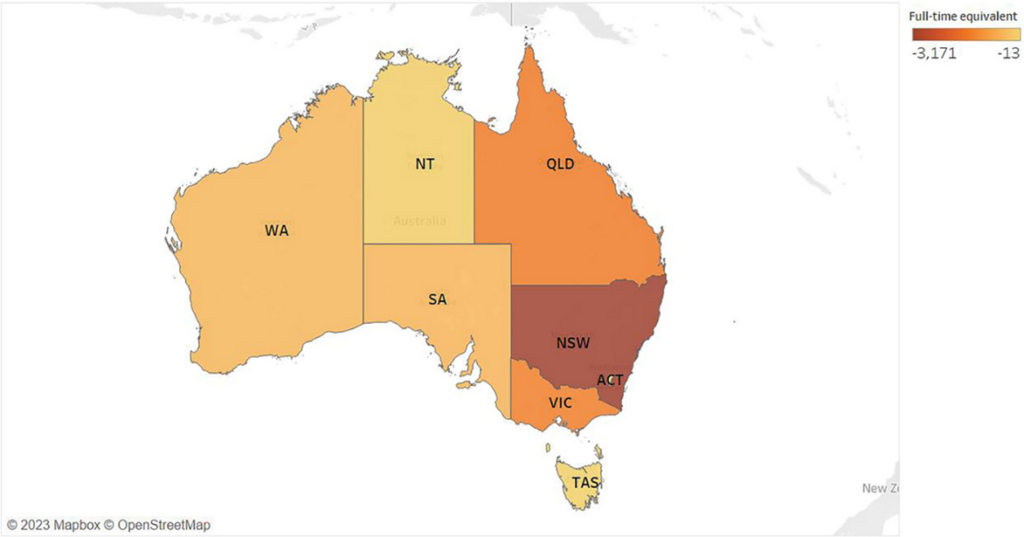
The fires, referred to as ‘Black summer’, reached a peak over the Christmas-New Year period, which coincided with Australia’s main tourism season. The economic impact from the damage to tourism alone included an estimated loss of $AU2.8 billion in total output and almost 7300 jobs.
The study, published in the Economics of Disasters and Climate Change, was reported in more than 100 media clips, including Channel News Asia television and The Guardian newspaper.
“As part of the world’s most disaster-prone region, the Asia Pacific, Australia has a lot to gain from climate-change mitigation,” said the study’s lead author, PhD student Vivienne Reiner. Co-author Associate Professor Arunima Malik added: “With bushfires increasing and intensifying because of global warming, it is important for countries such as Australia to quantify their economic impact as part of routine practice.”
ISA has pioneered quantitative disaster analysis, with studies spanning the potential for space weather disruption, Australia’s cyclone Debbie and Taiwan earthquakes. IO disaster analysis was later applied to COVID-19 in research led by ISA’s Professor Manfred Lenzen. The comprehensive analysis, published in PLOS ONE, uniquely quantified the socio-economic losses as well as environmental gains from the first global coronavirus lockdown. Looking to the future, supply-chain analysis of extreme weather scenarios in Australia projected not only potential consumption losses in food- and nutritional security but also identified the populations most at risk. The interdisciplinary group of researchers, from the University of Sydney and the NSW Government, published their findings in Nature Food.